What is neurofeedback ?
Neurofeedback is a biofeedback technique that allows real-time control of the brain's electrical activity. This is done using electrodes placed on the scalp to measure the electrical signals emitted by the brain. The signals are then processed by a computer, which transforms them into images and sounds, allowing the patient to visualize their brain activity.
The goal of neurofeedback is to teach the patient to control their own brain by providing rewards when the brain signals approach the desired state. For example, if the aim is to train the brain to produce more alpha waves, the patient can receive a visual or auditory reward each time the level of alpha waves increases.
Neurofeedback is often used to treat neurological disorders such as hyperactivity, anxiety, depression, sleep disorders, and attention disorders, as well as to improve mental and physical performance in athletes or artists.
In summary, neurofeedback is a technique that modifies brain activity in real time by using rewards to train the brain to produce specific electrical signals associated with a state of optimal health or mental performance.
The STEPS OF neurofeedback
1. initial ASSESSMENT
QEEG (Quantitative Electroencephalography) is a technique that analyzes the brain's electrical waves using EEG. This allows mapping brain activity in different regions and detecting areas with abnormal or dysfunctional activity.
When using QEEG in combination with neurofeedback, it allows for personalized training based on the specificities of each individual. After performing a QEEG, a therapist can identify the brain areas that require regulation or stimulation to improve brain function.
2. TRAINING
Next, during neurofeedback training, the individual receives real-time information about their brain activity and learns to regulate their brain to achieve specific goals. For example, if the QEEG analysis shows abnormally high activity in the brain region associated with anxiety, neurofeedback can help the individual regulate this activity and reduce anxiety symptoms.
In summary, QEEG-based neurofeedback training involves using the information provided by QEEG to personalize neurofeedback training according to the specific needs of each individual. This approach improves the training's effectiveness and yields faster and more precise results.
What does a QEEG assessment include?
Quantitative QEEG MAP
Quantitative EEG maps are analytical tools that visualize the brain's electrical activity in real-time and locate areas with abnormalities or dysfunctions. These maps are generated from the analysis of electrical signals recorded by the EEG from different regions of the brain.
Quantitative EEG maps are often presented as topographic maps. Each brain region is represented by a colored area on the map. Colors are used to represent different brain wave frequencies, which can be measured in hertz (Hz). For example, alpha waves have a frequency of about 8 to 12 Hz, while beta waves have a frequency of about 13 to 30 Hz.
The colors used on quantitative EEG maps are as follows:
Red: representing high electrical activity
Yellow: representing medium electrical activity
Green: representing normal or average electrical activity
Blue: representing low electrical activity
Dark Blue: representing very low electrical activity
The colored areas on the map indicate the level of electrical activity in each brain region. Red or yellow areas indicate high electrical activity, which can be associated with symptoms such as anxiety or hyperactivity. Blue or dark blue areas indicate low electrical activity, which can be associated with symptoms such as depression or drowsiness.
The use of quantitative EEG maps helps healthcare professionals locate the brain areas that require regulation or stimulation. This information can be used to plan treatments aimed at regulating electrical activity in areas identified as dysfunctional or abnormal.
qeeg comparatif pre et post entraînement
L'analyse QEEG (Quantitative Electroencephalography) est une méthode d'analyse de l'EEG qui permet d'obtenir des mesures précises et quantitatives de l'activité électrique du cerveau. Cette technique est utilisée pour évaluer les différences individuelles dans l'activité électrique du cerveau, qui peuvent être utilisées pour concevoir des protocoles de neurofeedback personnalisés pour chaque individu.
Le neurofeedback est une technique de thérapie basée sur la régulation de l'activité électrique du cerveau. Pendant une séance de neurofeedback, des électrodes sont placées sur la tête du patient et l'activité électrique de son cerveau est mesurée en temps réel. Cette activité est ensuite présentée sous forme de retour visuel à l'aide d'un écran d'ordinateur, d'un jeu vidéo ou d'autres moyens interactifs. Le patient apprend à réguler son activité électrique cérébrale en utilisant des techniques de relaxation et de concentration.
L'analyse QEEG est utilisée avant et après le traitement par neurofeedback pour évaluer les changements dans l'activité électrique du cerveau et mesurer l'efficacité du traitement. Les mesures QEEG peuvent fournir des informations précieuses sur les zones du cerveau qui nécessitent un entraînement supplémentaire et sur l'efficacité de l'entraînement.


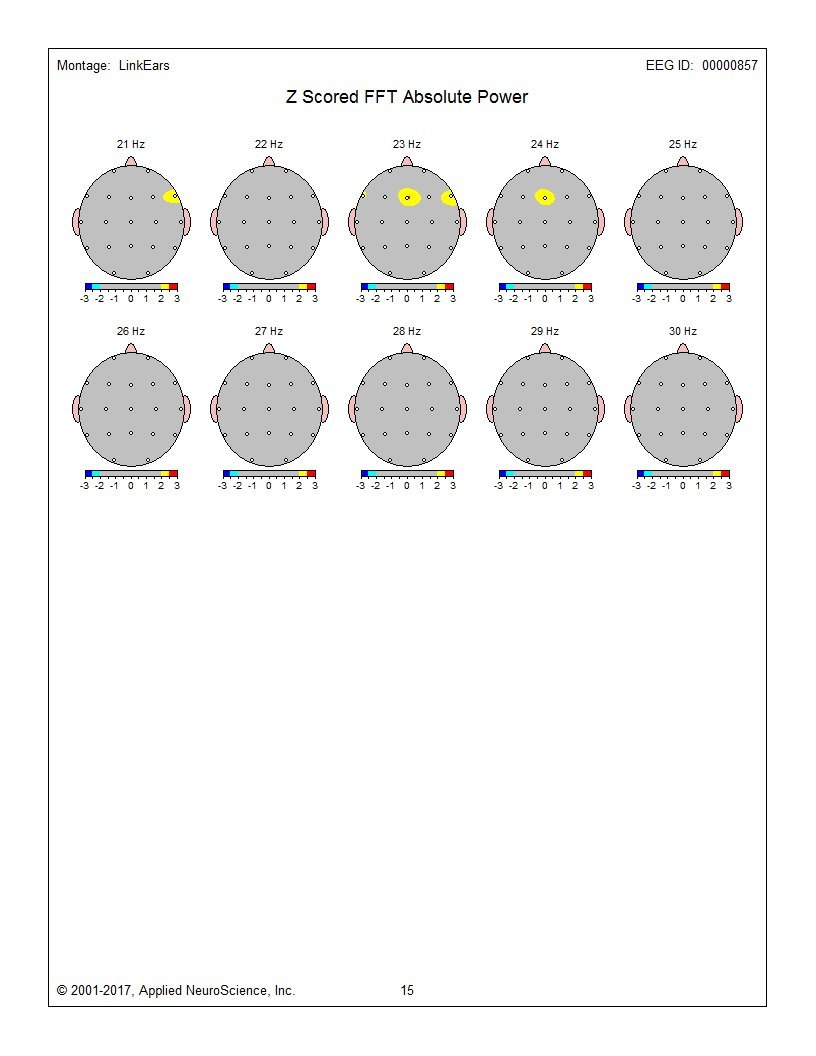
QEEG Statistical Map
EEG statistical maps are analytical tools that allow visualization of significant differences in the brain's electrical activity between different groups of people or experimental conditions. These maps are generated from the analysis of electrical signals recorded by the EEG and the use of statistical techniques to compare the differences in electrical activity between groups or conditions.
EEG statistical maps are often presented as topographic maps. Each brain region is represented by a colored area on the map, and the color used indicates whether there is a statistically significant difference between the groups or conditions.
The colors used on EEG statistical maps are often as follows:
Red: representing a statistically significant difference in electrical activity between groups or conditions
Yellow: representing a trend towards a statistically significant difference in electrical activity between groups or conditions
Gray: representing the absence of a statistically significant difference in electrical activity between groups or conditions
The colored areas on the map indicate brain regions that show statistically significant differences in electrical activity between groups or conditions. This information can be used to understand differences in brain electrical activity associated with various behaviors, diseases, or treatments.
For example, EEG statistical maps can be used to identify brain regions associated with symptoms of depression or anxiety. Statistical maps can also be used to assess the effects of different treatments on brain electrical activity, such as the use of psychotropic medications or non-drug therapies like neurofeedback.
In summary, EEG statistical maps are a powerful tool for analyzing differences in brain electrical activity between groups or conditions, providing valuable information for understanding various pathologies and evaluating treatments.
The changes observed in QEEG measurements can also help evaluate treatment efficacy for different conditions, such as anxiety, depression, ADHD, chronic pain, sleep disorders, and many others.
Using QEEG analysis, therapists can also adjust neurofeedback protocols in real-time based on observed changes in the patient's brain electrical activity. This allows for personalized and more effective treatment for each patient.
In short, pre- and post-neurofeedback QEEG analysis is a valuable tool for evaluating treatment efficacy, customizing treatment protocols, and adjusting treatment based on observed changes in the patient's brain electrical activity.